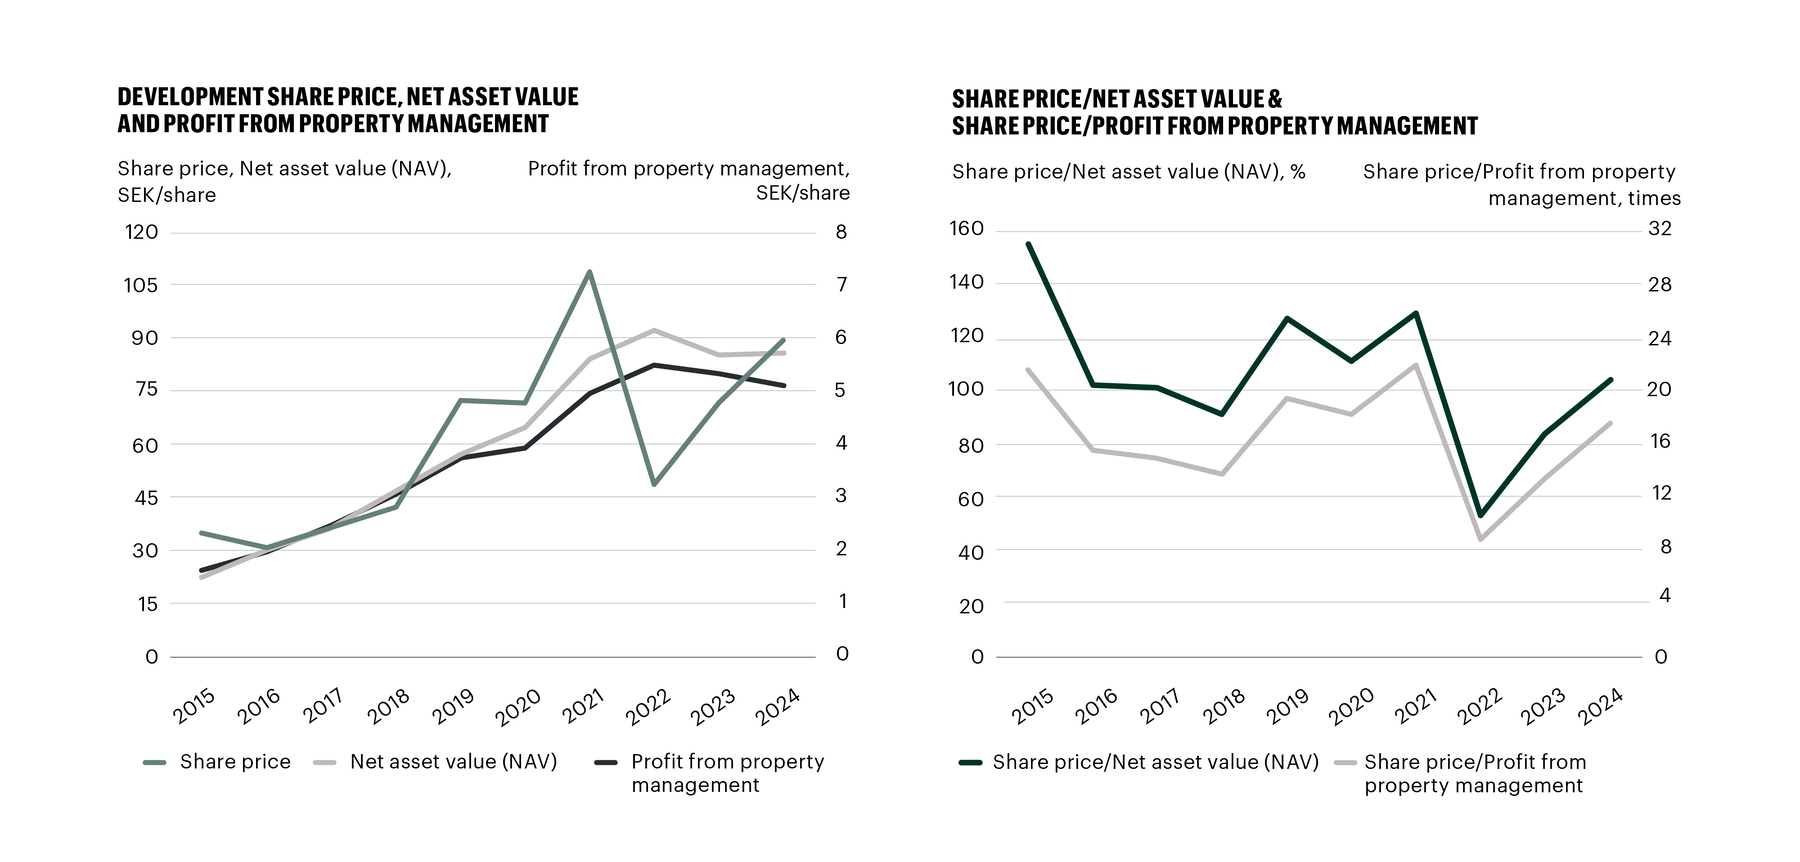
THE SHARE

The Balder share, Balder B, is listed on Nasdaq since 2005 and the share capital amounts to SEK 195,333,333 distributed among 1,172,000,000 shares. The principal owner is Erik Selin Fastigheter AB.

The Balder share is listed on Nasdaq Stockholm, Large Cap. The share capital in Balder amounts to SEK 195,333,333 distributed among 1,172,000,000 shares. Each share has a quota value of SEK 0.16667, of which 67,376,592 shares are of Class A and 1,104,623,408 are of Class B. Each Class A share carries one vote, and each Class B share carries one tenth of one vote. 

The principal owner in Fastighets AB Balder is Erik Selin Fastigheter AB, which holds 33.5% of the capital and 47.3% of the votes. Other major owners are Arvid Svensson Invest AB, Swedbank Robur Fonder and AMF Fonder & Pension. The number of shareholders is currently approximately 30,700. 

The share’s performance over time

Tables dated 30 September 2024. 

The dividend 

Balder’s goal is to generate the best long-term total yield for its shareholders. The assessment is still that this is best achieved by reinvesting the profits in the business in order to create further growth. For this reason, the dividend will remain low or will not be declared at all.

Analysts following Balder

  • Staffan Bülow, Nordea
  • Erik Granström, Carnegie
  • Fredric Cyon, Carnegie
  • Markus Henriksson, ABG Sundal Collier
  • Jan Ihrfelt, Kepler Cheuvreux
  • Albin Sandberg, Kepler Cheuvreux
  • Johan Edberg, Handelsbanken
  • Stefan Andersson, Danske Bank
  • Lars Norrby, SEB
  • Emil Ekholm, Pareto
  • Viktor Hökenhammar, Pareto
  • Niklas Wetterling, DNB

OWNERSHIP LIST

Owners Class A shares Class B shares Total number of shares Capital, % Votes, %
Erik Selin and company 49,855,968 343,265,400 393,121,368 33.5 47.3
Arvid Svensson Invest AB 17,495,352 73,799,819 91,295,171 7.8 14.0
Swedbank Robur Fonder - 76,479,866 76,479,866 6.5 4.3
AMF Fonder & Pension - 59,698,389 59,698,389 5.1 3.4
Länsförsäkringar Fondförvaltning - 34,623,549 34,623,549 3.0 1.9
Lannebo Kapitalförvaltning - 22,092,826 22,092,826 1.9 1.2
SEB Investment Management - 21,746,082 21,746,082 1.9 1.2
Handelsbanken Fonder - 21,490,577 21,490,577 1.8 1.2
Folksam - 17,312,047 17,312,047 1.5 1.0
Cliens Kapitalförvaltning - 13,837,789 13,837,789 1.2 0.8
Others 25,272 420,277,064 420,302,336 35.9 23.6
Total 67,376,592 1,104,623,408 1,172,000,000 100 100

Data per 2024-09-30.

Source: Euroclear.

SHARE-RELATED KEY FIGURES

Multi-year summary 2023 2022 2021 2020 2019 2018 2017 2016 2015 2014 2013 2012 2011 2010 2009 2008 2007
Rental income, SEKm 11,944 10,521 8,956 8,134 7,609 6,714 5,915 5,373 2,711 2,525 1,884 1,701 1,466 1,333 854 633 678
Profit from property management, SEKm 6,135 6,139 5,543 4,244 4,023 3,304 2,804 2,265 1,780 1,275 854 691 516 417 315 174 179
Changes in value of investment properties, SEKm -9,995 5,530 13,111 3,453 9,577 8,007 5,336 4,932 3,388 3,050 854 812 990 1,047 4 -201 642
Changes in value of derivatives, SEKm -1,899 1,617 511 -141 -180 -34 144 -114 227 -624 433 -71 -520 148 -23 -333 7
Profit after tax, SEKm -6,746 10,175 18,508 6,641 8,958 9,308 7,118 5,474 4,916 3,128 1,738 1,162 812 1,338 248 -388 785
Investment properties, SEKm 209,000 213,932 189,138 149,179 141,392 116,542 98,360 86,177 68,456 37,382 27,532 22,278 17,556 14,389 12,660 7,086 6,758
Development properties, SEKm 2,750 3,421 2,697 2,803 2,344 1,598 - - - - - - - - - - -

Data per 2022-12-31.

Source: Balder's year-end report 2023.